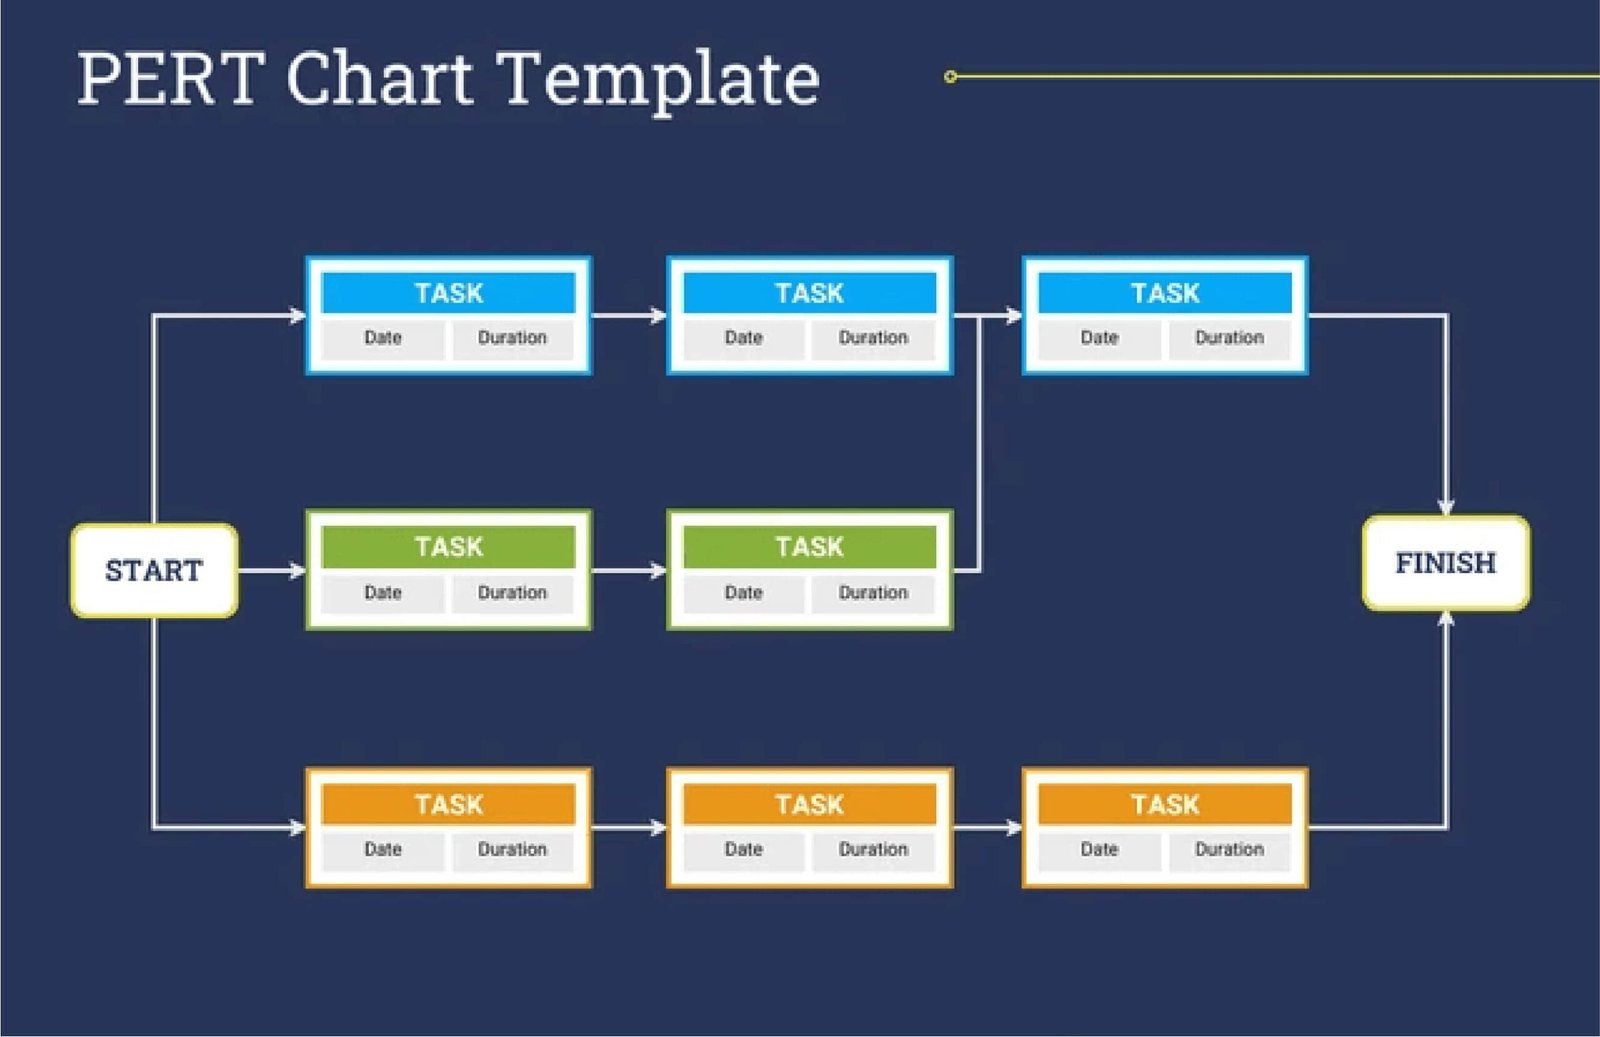
The Program Evaluation Review Technique (PERT) chart stands as a valuable tool in project management. It provides a visual representation of a project’s timeline, highlighting tasks, durations, and dependencies. This structured approach helps project managers plan, schedule, and control complex projects. A PERT Chart Analysis Template can streamline the process, ensuring thorough and consistent analysis.
A PERT chart is a project management tool used to schedule, organize, and coordinate tasks within a project. It breaks down the individual tasks and identifies the minimum time needed to complete the total project.
Components of a PERT chart include:
- Events (or Milestones): Significant points in the project timeline, often represented by circles or rectangles.
- Tasks (or Activities): Work required to move from one event to another, depicted as arrows connecting the events.
- Dependencies: Relationships between tasks, indicating the sequence in which activities must be completed.
Related Article: 9 Key Components Of Project Dashboard Template – PMITOOLS

Creating a PERT Chart Analysis Template
A PERT Chart Analysis Template serves as a structured guide for developing and analyzing PERT charts. It ensures consistency and comprehensiveness in planning and reviewing projects. Here are the steps to create a PERT chart analysis template:
- Define Project Scope and Objectives: Start by outlining the project’s scope and objectives. Clearly state what the project aims to achieve and the criteria for success. This foundation guides all subsequent steps.
- List All Tasks and Activities: Break down the project into smaller tasks. List all activities necessary to complete the project. Be thorough to ensure no crucial steps are missed.
- Determine Task Durations: Estimate the time required to complete each task. Use three-time estimates for accuracy:
- Optimistic Time (O): Minimum time needed to complete a task under ideal conditions.
- Most Likely Time (M): Time required under normal conditions.
- Pessimistic Time (P): Maximum time if challenges arise.
- Identify Dependencies: Determine the sequence of tasks. Identify which tasks depend on the completion of others. This step is crucial for mapping out the project timeline accurately.
- Construct the PERT Chart: Use the information gathered to create the PERT chart. Plot events as nodes and tasks as arrows connecting the nodes. Ensure the chart reflects all dependencies and sequences.
- Calculate Critical Path: Identify the critical path, which is the longest path through the PERT chart. It determines the shortest possible project duration. Any delay in the critical path delays the entire project.
- Analyze and Review: Regularly analyze the PERT chart throughout the project. Review progress, update estimates, and adjust plans as needed to ensure the project stays on track.
Related Article: 8 Tips For Designing Product Roadmap Template – PMITOOLS
Role of PERT Charts in Project Management
PERT charts play a crucial role in project management by providing several benefits:
- Improved Planning and Scheduling: PERT charts offer a clear visual representation of the project timeline, making it easier to plan and schedule tasks. They help project managers identify the sequence of activities and allocate resources efficiently.
- Enhanced Decision-Making: By illustrating the dependencies and critical path, PERT charts assist in decision-making. Project managers can prioritize tasks, focus on critical activities, and make informed choices about resource allocation and scheduling.
- Risk Management: PERT charts incorporate three-time estimates, allowing project managers to account for uncertainties and risks. This approach helps in identifying potential delays and developing contingency plans to mitigate risks.
- Progress Tracking and Control: PERT charts provide a framework for tracking project progress. Regularly updating the chart with actual task durations helps in comparing planned vs. actual performance. It enables project managers to take corrective actions promptly.
- Communication and Coordination: A PERT chart serves as a communication tool, facilitating better coordination among team members. It provides a shared understanding of the project timeline, task dependencies, and critical milestones, ensuring everyone stays aligned.
Practical Applications of PERT Charts
PERT charts find applications across various industries and project types. Here are some examples:
- Construction Projects: In construction, PERT charts help in planning the sequence of activities, from site preparation to project completion. They ensure tasks like foundation laying, framing, and finishing follow a logical order, preventing delays.
- Software Development: For software projects, PERT charts assist in managing the development lifecycle. They outline stages like requirement analysis, coding, testing, and deployment, ensuring timely delivery of the software product.
- Event Planning: Event planners use PERT charts to coordinate tasks such as venue booking, catering, marketing, and logistics. This structured approach ensures all activities align, resulting in successful event execution.
- Research and Development: In R&D projects, PERT charts help manage the innovation process. They outline tasks like hypothesis formulation, experimentation, data analysis, and reporting, ensuring the project progresses systematically.
- Manufacturing: PERT charts streamline production processes by scheduling tasks like material procurement, assembly, quality control, and distribution. They help in optimizing production timelines and meeting delivery deadlines.
Related Article: 9 Tips To Create A Status Update Email Template – PMITOOLS

Limitations of PERT Charts
While PERT charts offer numerous benefits, they also have limitations:
- Complexity: For very large projects, PERT charts can become complex and difficult to manage. The sheer number of tasks and dependencies can make the chart cumbersome and challenging to update.
- Time-Consuming: Creating and maintaining a PERT chart requires significant time and effort. Estimating task durations and dependencies accurately demands thorough analysis and constant updates.
- Uncertainty in Estimates: PERT charts rely on time estimates that can be uncertain. Inaccurate estimates can lead to incorrect critical path identification and flawed project planning.
- Overemphasis on Time: PERT charts focus primarily on time management and may overlook other critical project aspects such as cost, quality, and resource availability. Balancing these factors requires additional tools and techniques.
Best Practices for PERT Chart Analysis
To maximize the effectiveness of PERT charts in project management, consider these best practices:
- Involve the Team: Engage the project team in the PERT chart creation process. Their insights and expertise contribute to more accurate task identification and time estimates.
- Regular Updates: Keep the PERT chart up-to-date with actual progress. Regular updates help in identifying deviations from the plan and taking corrective actions promptly.
- Use Software Tools: Leverage project management software that supports PERT chart creation and analysis. These tools simplify the process, provide automation, and enhance accuracy.
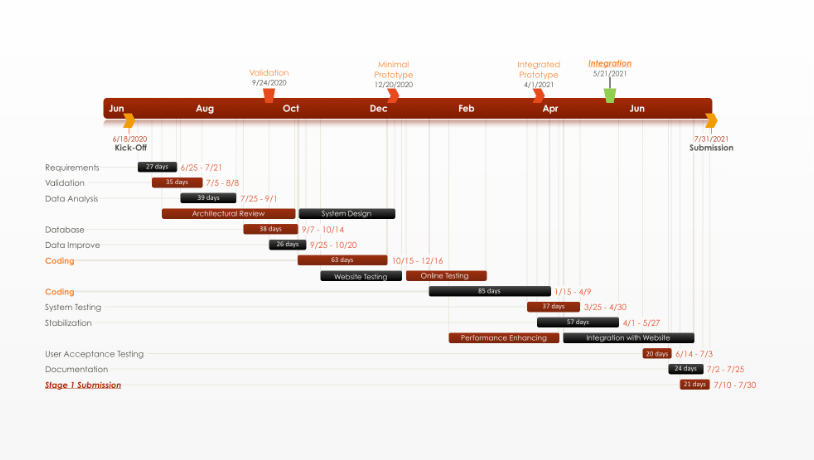
- Combine with Other Techniques: Use PERT charts in conjunction with other project management techniques like Gantt charts, Critical Path Method (CPM), and risk analysis. This integrated approach ensures comprehensive project planning and control.
- Focus on Critical Path: Pay special attention to the critical path and tasks along it. Ensuring timely completion of critical activities prevents project delays and helps in meeting deadlines.
Read More: Program evaluation and review technique – Wikipedia
Conclusion
PERT Chart Analysis Template provides a structured approach to developing and analyzing PERT charts. By defining project scope, listing tasks, estimating durations, and identifying dependencies, project managers can create detailed and accurate PERT charts. These charts play a vital role in improving planning, decision-making, risk management, progress tracking, and communication in project management. Despite their limitations, PERT charts remain an essential tool for managing complex projects across various industries. By following best practices and leveraging modern tools, project managers can harness the full potential of PERT charts to ensure project success.


