
This template is user friendly, very easy to use and understand and is use to categorize your product on the bases of its potential and value in the market. The classification is because of the competition that a product has to face in the market for resources.
Related Article: Business Management Plan
BCG matrix template excel is useful for making a successful strategy and planning for your business. This is also helpful in analyzing the portfolio of a business. It allows you to make best decisions for your business to make it successful in every way possible. It guides you about the decision that in which bran your firm should invest for its better future. Benefits are mention below
- It is user friendly template, very simple to understand
- this template allow you to analyses business portfolio for the betterment of future
- Its also gives the directions for better decision making
- Allows you have strategic planning for the management of your business
- Gives you the right guidance for handling your business in an appropriate way.
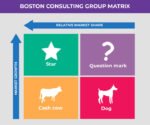
In BCG template two variables are plot along two axis, use in project management.
Relative Market Share can be plot along the horizontal axis. Greater the market share greater will be the cash generated and your business get more successful.
Relative Market Growth can be plot along vertical axis. Greater the market growth of the product greater will be the earning from that product but you have to invest more for maintaining the production of that product and for fulfilling its requirement.
How To Analyze A Project Through BCG Matrix Template
A project is analyze in best way by using BCG template. It gives you all the information, is your business progressing or having a down fall. If your product is healthful for the growth of your business or is it taking the business towards the loss. What measure you should take to keep your business safe and what decision should be made to keep the business safe from any down fall.
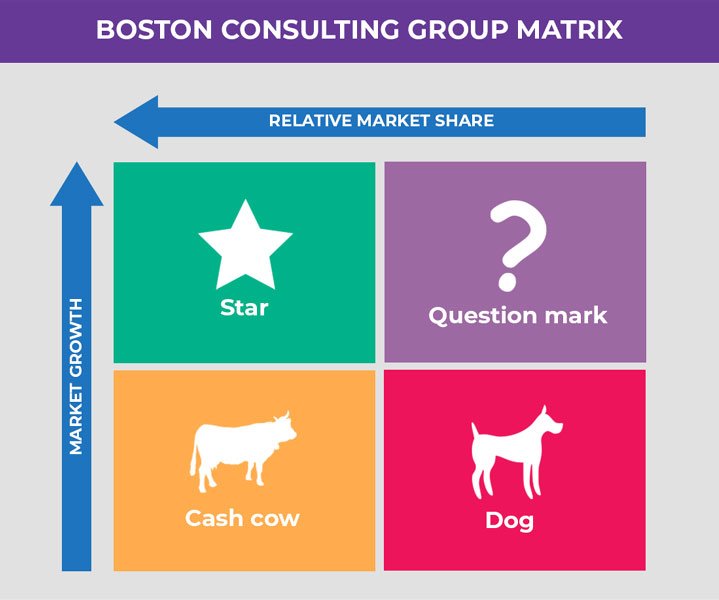
To analyze all this In BCG matrix template products are sorted into four categories
- Cash Cow: it contain the products with high market share and low growth rate. This type of product earns great profit and saves funds for the future use. Don’t try to expand the business in this situation by further investment because market growth rate is low at this time. It may come in the category of star in the near future.
- Dogs: it contain the product with low market share in a slow growing market. The amount of profit earned is usually less. In this situation a defense is build against competitors in the market. Better to eliminate this product as soon as possible
- Question Mark: it contain the products with low market share in high growth market. If the market growth slows they may fall in cash cow category but keep hope, it may gain more market share to become a star but you have to be very careful in analyzing your business. invest more for product development and market development
- STAR: it contain the products with high market share in fast growing market. This type of product earns more profit and give you the opportunity to expend your business. If your product lies in this category in ensures the success of your business. You have to keep resources for maintaining your market position.
How To Create BCG Matrix In Excel
Excel provides a verity of template to perform different tasks in project management. This template can also be create on excel which can be very helpful. First of all analyze the chart having relative market share on horizontal axis and relative market growth on vertical axis. This will make you aware of the potential of the company’s product and the n follow the given steps
- Arrange the data: For creating a successful BCG template first get and arrange the data. The data required includes market share, market growth, competitor with highest market share and the relative market share. Specific formulas can be used for this purpose
- Bubble chart: now create s bubble chart using first three columns of your table
- Convert the chart into BCG matrix: By right clicking on x-axis an then click on “select data” and then click on edit button. It will notify you that your BCG matrix template is update then go for the format of BCG template. Finally click on close button
- After formatting the template: Get your background colour as per your requirement.

Summary is that BCG matrix template excel helps you in business handling in very effective way. You can make better decisions for your business and avoid the unfavourable conditions using this template. This will help you to lead your business towards success.